
ProcDump
Monitor applications and generate crash reports
Description
As an intuitive application monitor, ProcDump simplifies debugging by producing dump files for active processes during crashes or performance issues. It runs lightweight in the console, tracking processes for events such as memory spikes or hangs, then captures snapshots for analysis. These dumps help pinpoint faulty code or resource leaks, accelerating problem resolution in development and production environments. Its straightforward commands make it accessible for quick diagnostics and enhancing application reliability.
Screenshots
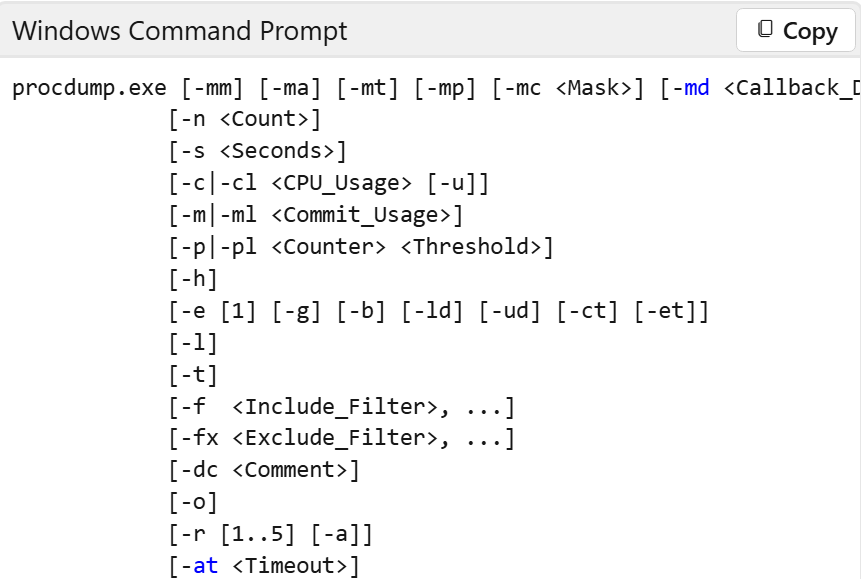
Click to view full size